Skin lesion triage,
without the hardware.
3D total-body imaging is the clinical standard, and the hardware is expensive. This project measured one question: how much of that device's signal survives in an ordinary photograph?
Developed at PMAA, Kayseri.
across 1,042 patients
patient-grouped 5-fold
and an independent test
at 99% sensitivity
The answer, measured.
Across 401,059 lesions, once the image is already available, the device's 33 additional measurements contribute less than 0.005.
This is not a failure to find a difference. It is a narrow equivalence interval: 95% CI [−0.0054, +0.0040].
The claim is not that the hardware is worthless. Device measurements contribute strongly when no image is available (+0.0438). Add the image and that contribution disappears — the information the device produces is already present in a phone-quality photograph. The relationship is asymmetric: the image subsumes the device, the reverse does not hold.
Verified by someone else.
Claiming that your own cross-validation is not optimistic is not enough; it has to be shown. Both arms were submitted to the hidden test set of the ISIC 2024 challenge — one submission per arm, with no tuning after seeing the result.
| Arm | Our own evaluation | Public test | Private test |
|---|---|---|---|
| Device-free | 0.1630 | 0.16359 | 0.15142 |
| With device | 0.1628 | 0.16712 | 0.15525 |
| Difference | −0.0003 | +0.00353 | +0.00383 |
The device-free arm scored 0.1630 in our own evaluation and 0.16359 when a third party measured it on data we never saw — a gap of 0.0006. Different patients, independent test, someone else's arithmetic, effectively the same number.
One stage screens. The second decides.
Stage 1 answers "is this lesion worth looking at" from an ordinary photograph. But 60% of the malignant signal it detects is not melanoma, so it cannot answer "is this melanoma". That gap was measured, not assumed — and it is why a second stage exists.
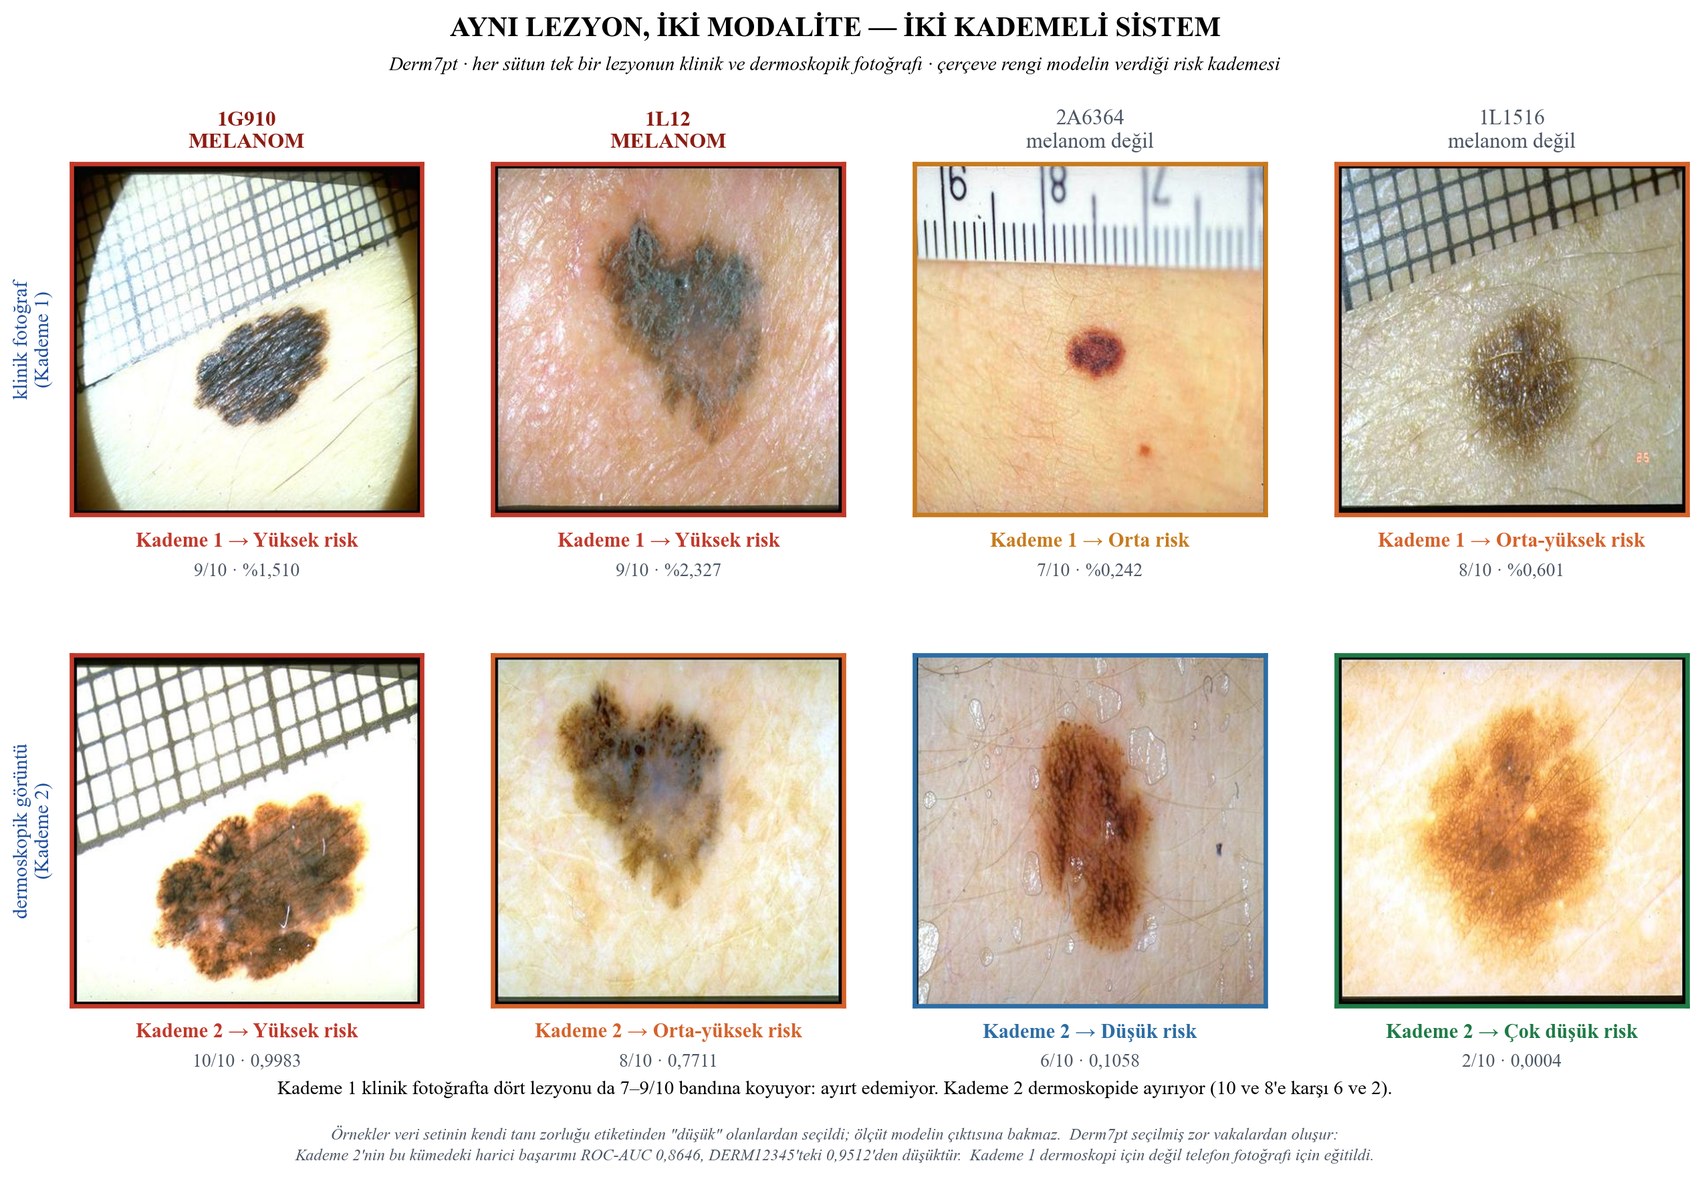
Stage 1 — screening
A photograph and a few routinely available clinical fields produce a calibrated risk and a position in the review queue.
Stage 2 — discrimination
A dermoscopic image separates melanoma from the rest. Clinical fields were measured here and added nothing.
Stage 2 was trained after removing 1,132 duplicate groups found in the source data and rebuilding a patient-grouped split. An earlier study on the same dataset reported 0.9491; with duplicates removed and the split tightened the number fell to 0.9319 — the difference is what the leakage was worth. It then scored 0.9512 on an independent 12,345-image cohort from four institutions with zero overlap against training data.
What it looks like on real cases.
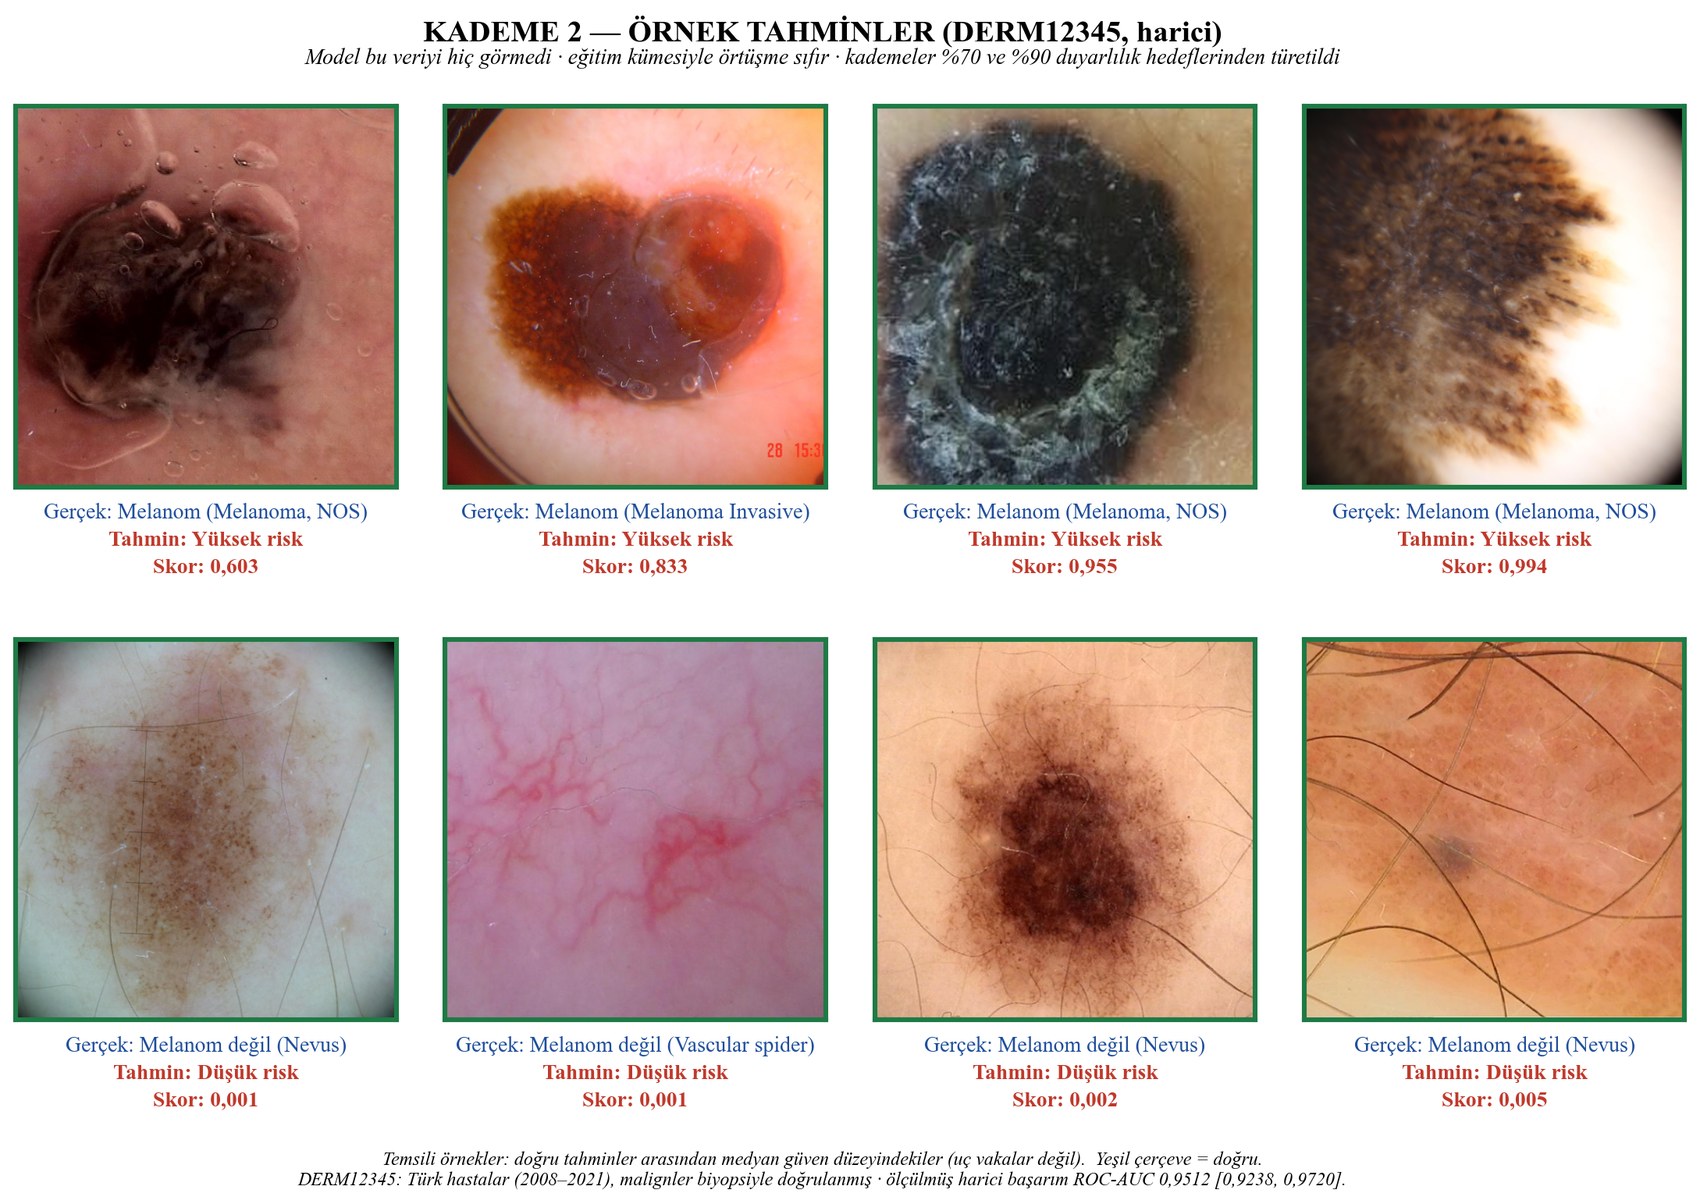
These are stage 2 predictions on an entirely external cohort — Turkish patients imaged between 2008 and 2021 across four institutions, with every malignancy confirmed by biopsy. The model never saw this data, and overlap with the training set is zero.
Does it look at the lesion?
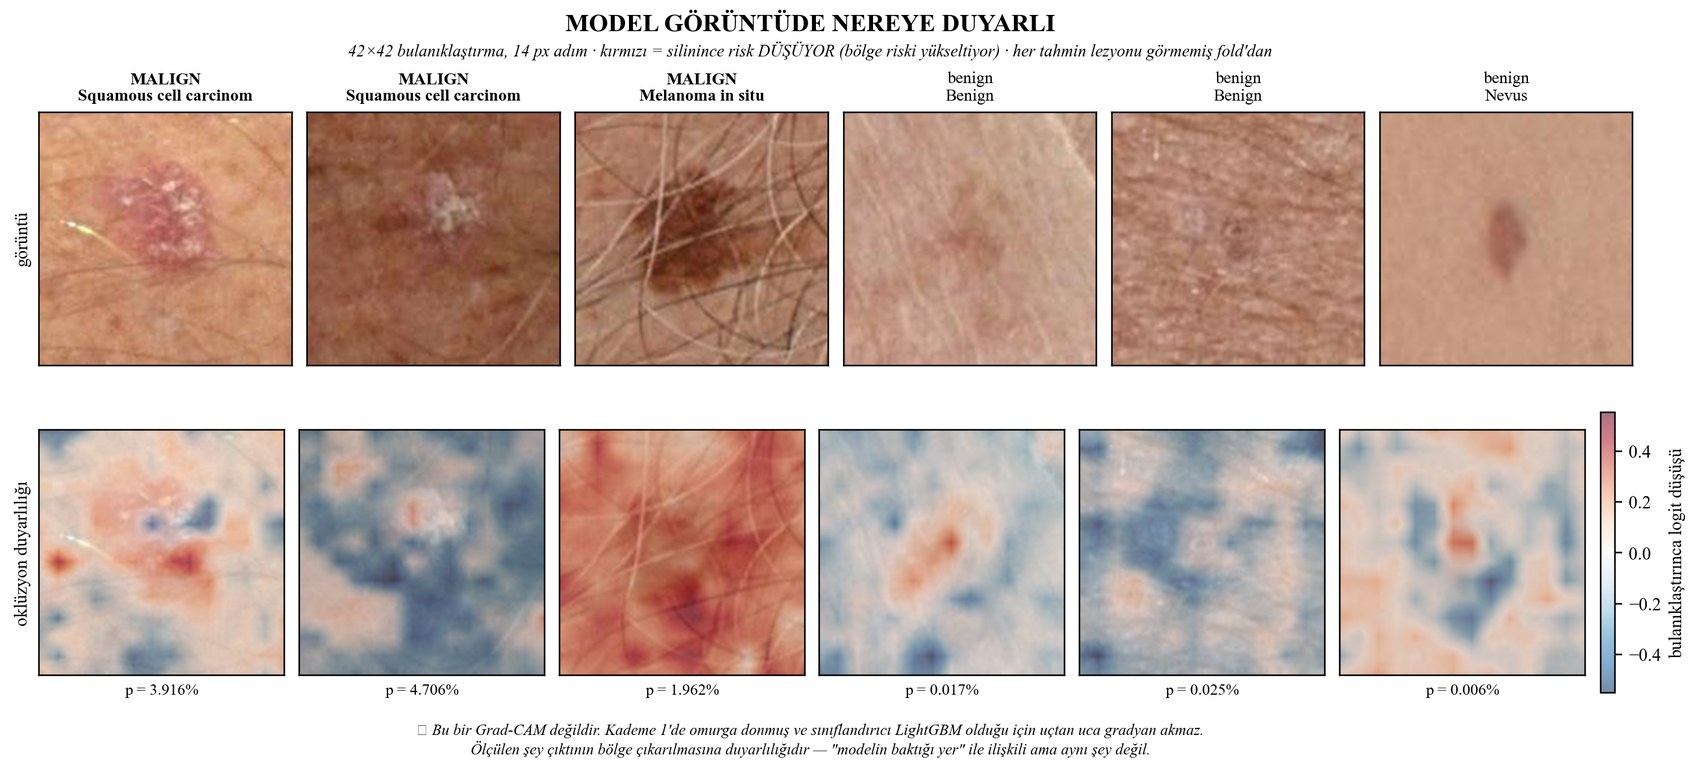
A sanity check that matters more than an accuracy number: is the model responding to the lesion, or to something incidental in the frame?
Prioritisation, not exclusion.
A patient undergoing 3D screening carries roughly 385 lesions to review. The model orders that list. The clinical question is not "how many lesions should we look at" but "how many cancers are we willing to miss".
at 99% sensitivity
385 lesions fall to 165 per patient.
at 95% sensitivity
385 fall to 93.
at 90% sensitivity
385 fall to 54.
Threshold transferability was tested separately: choosing the threshold on other folds and measuring it on a held-out fold costs at most 1.0 point of sensitivity. The top row is both the most defensible and the most stable operating point.
A service, not a notebook.
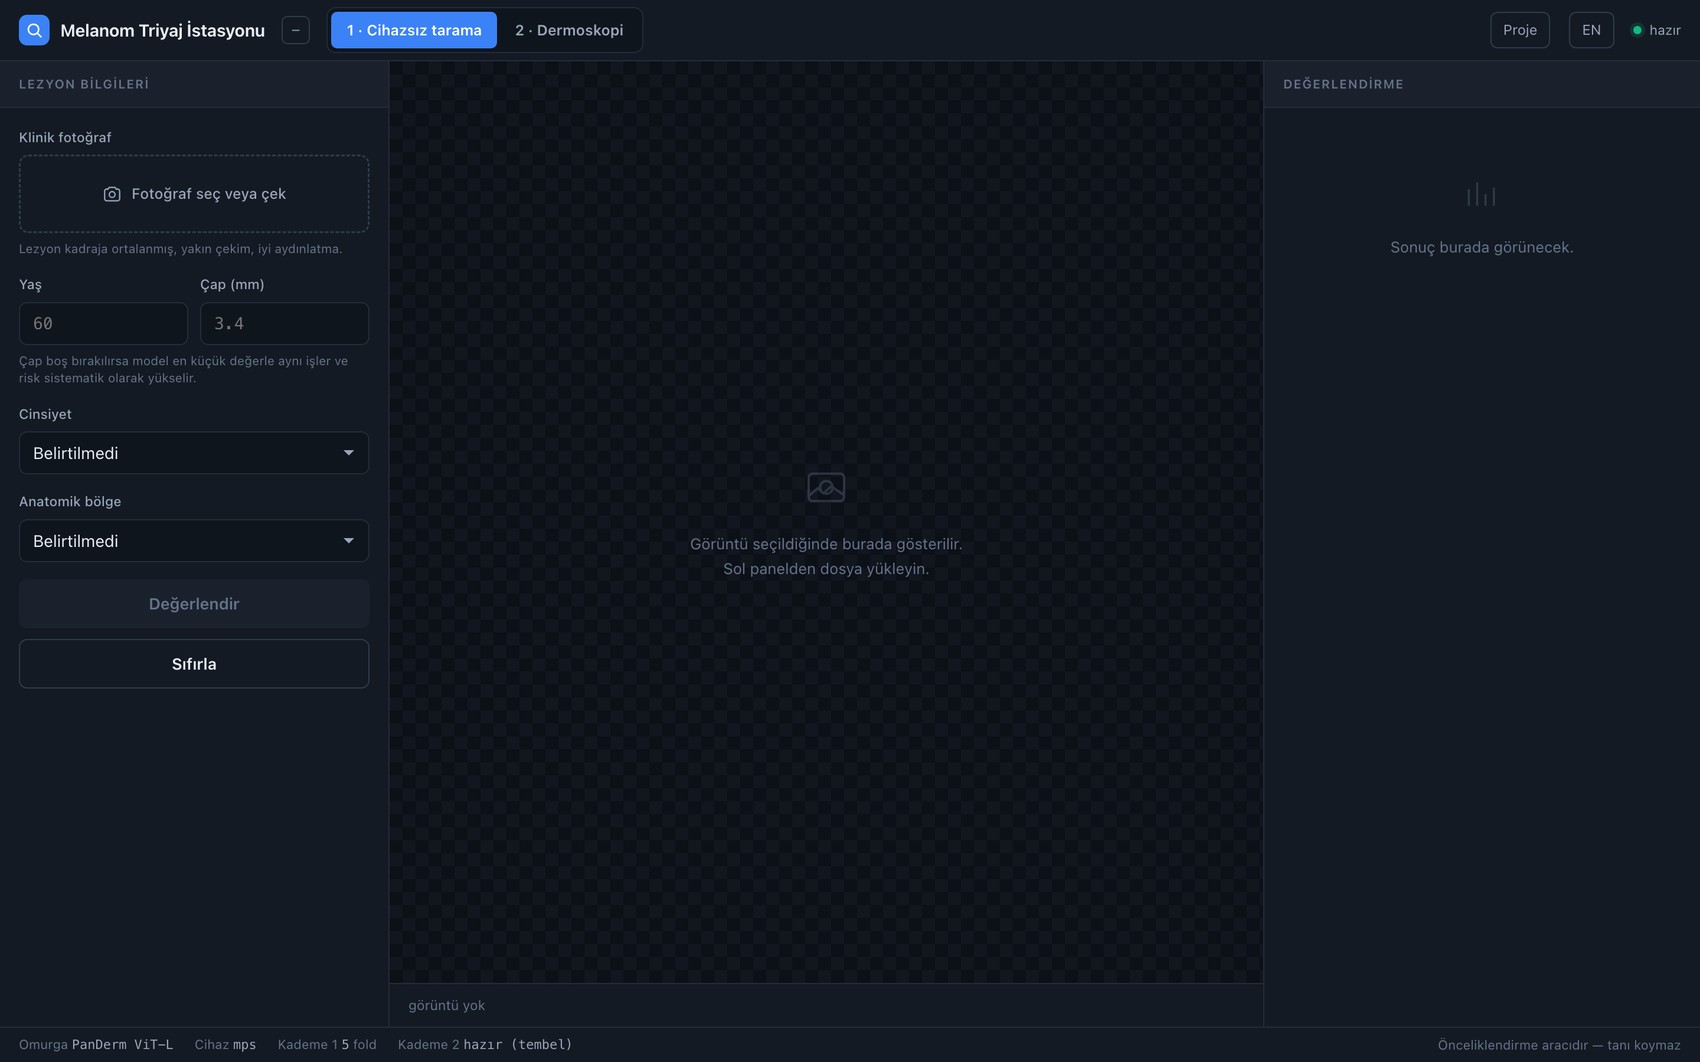
Both stages sit behind an HTTP service with a documented response schema, packaged as a container. The interface returns a calibrated probability, a triage percentile and the operating point the lesion falls into — never a raw score.
Stage 1 latency
Median, on CPU.
Stage 2 latency
Median, on CPU.
Container drift
Identical predictions to the development machine.
Dependency versions are pinned, because an unpinned upgrade was observed to shift predictions. With them pinned, two different operating systems on two different processors return the same number for the same lesion — verified against stored predictions rather than assumed.
Continuous integration runs on every commit and deliberately targets the failures that are silent: the ordering of features, the calibration constants, the operating-point thresholds and the response contract. That suite exists because one such failure was found during development — the model kept running, it simply ran wrongly.
The design principle.
The clinical inputs are not there to repeat the image, but to supply what the image physically cannot contain.
Colour, asymmetry and border are already in the photograph, and the network reads them better than hand-crafted descriptors do — a full morphometry layer was built, measured against the alternative, and dropped for exactly this reason. Lesion size is the opposite case: it cannot be recovered from an uncalibrated photograph at all. Even given a perfect segmentation mask, the correlation with true physical size was ρ = 0.19, p = 0.31. That is an information-theoretic limit rather than a model-capacity problem, and the fix has to come from outside the model — a scale reference in the frame.
Two decisions worth naming
Both were settled by measurement rather than preference, and both go against a common default. The backbone is adapted in one stage and left alone in the other: with only 393 positive cases in stage 1, adapting a large vision model was tried and measured worse than leaving it fixed; stage 2 has 5,479 positives and the decision reverses. The raw probabilities were unusable: ranking was excellent, but the model underestimated prevalence by 11.4×, so no sentence of the form "this lesion carries an X% risk" could honestly be built from it. A calibration step was fitted on held-out data and validated.
What it is not.
Four separate sources of leakage were caught in our own work and removed, and three approaches were measured and dropped. Refuted hypotheses were not hidden, and neither are these limits.
- Not a diagnostic device. It prioritises; it does not replace clinical judgement.
- Weakest on head and neck (0.9066), which is also the highest-prevalence site.
- Light-sensitive. Under heavy low light the image channel loses its contribution. Good lighting and uncompressed capture are conditions of use, not suggestions.
- Capture mode leaks through the image. Performance differs between two capture modes even though that variable was never given to the model.
- Stage 2 requires a dermoscopic image. Feeding it a phone photo produces a domain shift and an invalid result.
- No prospective clinical validation. All results are retrospective.
Privacy
The demo is built so that there is nothing to retain:
- The uploaded image is held in memory only for the duration of the request and is never written to disk.
- No account, no database, no image storage. Nothing is kept after the response is returned, so nothing can be re-identified later.
- No personal data is requested; the clinical fields are coarse, non-identifying values.
- Results are not used for training or any further processing.
This is a demonstration, not a clinical system, and it must not be used for medical decisions.